Dividend Portfolio

Tuesday, November 9, 2010

Abbott Laboratories: Looking to Emerging Markets for Growth


In an article dated October 18, 2010, I compared and performed relative valuation of 6 major drug companies.  In this article, I will focus on Abbott Laboratories (ABT) and present my discounted cash flow analysis results for the company. 

ABT is primarily divided into 4 operating segments namely Pharmaceuticals, Nutritional Products, Diagnostics, and Medical Services.  Although commonly seen as a pharmaceutical company, this segment contributed only about 55% of the total company revenues during the first nine months of this year.  Nutritional Products accounted for approximately 16% of total sales.  International sales were responsible for 57% of total revenues. 

Abbott has a diverse product offering which it markets in 130 countries.  Its blockbuster drug HUMIRA (used in the treatment of rheumatoid arthritis and psoriatic arthritis) accounted for 33% of the company’s global pharmaceutical sales.  Other major products include TRILIPIX, TriCor and Kaletra which together contributed $2 billion in global sales.  The US patent for HUMIRA will expire in December 2016.  Several other patents expire during this decade.

To make up for the impending patent expirations, ABT has been investing significant amounts of money to develop new products. For example, in fiscal year 2009, ABT invested approximately $2.7 billion into R&D.  The company expects to introduce 75 new products and indications (including non pharma) during the next 5 years.  Still, several analysts believe that ABT’s pipeline lags its peers like Merck (MRK).    

Abbott is known for its aggressive acquisitions having closed three major deals this year.  These acquisitions provide an attractive opportunity for growth.  The company bought Solvay Pharmaceuticals early this year as part of its strategy to gain a foothold in emerging markets.  Emerging markets, the company reports, are growing at three times the rate of developed markets.  In September, the company announced the acquisition of Piramal’s Healthcare Solutions Business in India. This acquisition catapulted ABT into a leadership position in the generic pharmaceutical business in India.  India is the 2nd fastest growing emerging market and the $8 billion pharmaceutical market is predicted to double by 2015.  ABT expects to generate about $2.5 billion in sales from India by 2020. 

Nutritional Products segment is another growth driver for ABT.  The company reports that it is the fastest growing nutritional company in international markets and expects to maintain its double digit growth.  It continues to gain market share in infant nutritionals and is a leader in adult and therapeutic nutritional products.  As is the case with the pharmaceuticals segment, emerging markets should provide significant opportunities for growth in the nutritional segment.

Discounted Cash Flow Valuation

DCF valuation was performed by employing a two-stage model with a high growth period of 10 years.  The major inputs and the valuation results are presented below. 


ABT
Bottom-Up Beta for High Growth
1.29
Bottom-Up Beta for Stable Growth
1.20
Equity Risk Premium
6.5%
Cost of Equity for High Growth
10.89%
Cost of Equity for Stable Growth
10.30%
Average Growth Rate (Years 1-5)
10%
Average Growth Rate (Years 6-10)
5.5%
Stable Growth Rate
2.5%

Valuation
Present Value of FCFE in High Growth Period (Billions)
$48.1
Present Value of Terminal Value of Equity (Billions)
$48.2
Cash, Marketable Assets and Non-Operating Assets (Billions)
$5.7
Total Equity Value (Billions)
$102

Market Value of Equity/Share
$66

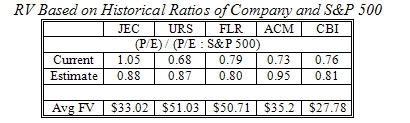
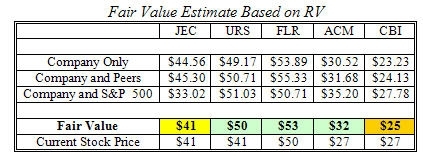
As shown above, my DCF analysis yields a fair value of $66 a share.  My relative valuation analysis indicated a fair value of $60 a share.  Combining the two values, my price target for ABT is $63 a share.  As of November 8, 2010, ABT was trading at $50.45 a share implying a discount of approximately 20%.  Additionally, the stock currently yields a healthy 3.5% compared to the 2.55% yield of the 10-year Treasury note.  At these levels, ABT makes a compelling investment opportunity with a total return potential of about 25 to 30% in 12-months. 

(Kindly use this article for information purposes only. Please consult your investment advisor before making any investment decision)

Disclosure: None, I will open a position in ABT three days after this article is posted subject to ABT trading below $52 a share.   

Sunday, November 7, 2010

Analyzing Major Engineering and Construction Firms Using Relative Valuation


The recent economic downturn had a major impact on the Engineering and Construction (E&C) industry with the cancellation and postponement of several projects. Things appear to be improving for the industry with several new projects on the horizon. I am optimistic about the infusion of fresh capital in highways and rail projects, power generation projects, and oil and gas exploration projects.
The performance of E&C sector is a lagging indicator of the economy. Investing in this sector will probably not yield significant returns in the short term, but should provide handsome returns in the long term. As a contrarian investor, I find this sector fairly attractive for investments and am therefore in the lookout for attractively priced strong companies in this sector.
This article presents the relative analysis results conducted for five major E&C companies, namely Jacobs (JEC), URS (URS), Fluor (FLR), AECOM (ACM), and Chicago Bridge & Iron (CBI).
The financial and fundamental information for the companies mentioned above are shown in table that follows:
Relative valuation (RV) was performed by 3 different methods.
1) RV based on historical ratios of the company alone
2) RV based on historical ratios of the company and its peers
3) RV based on historical ratios of the company and S&P 500
It should be noted that the historical data was taken in calculating the estimates used in this analysis. Adjustments were made to account for outliers present in the dataset. The TTM EPS, revenues, and the book values for the five companies are shown the table that follows:
Relative valuation based on historical ratios of the company alone
In this analysis, the current P/E, P/S and P/B ratios were compared to the historical ratios of the individual companies and an estimate for the respective ratios was obtained. Fair value was calculated by applying these estimates to TTM EPS, sales per share and book value.
Relative valuation based on historical ratios of the company and peers
In this analysis, the current P/E, P/S and P/B ratios were compared to the peer companies and an estimate for the respective ratios was obtained. Fair value was calculated by applying these estimates to TTM EPS, sales per share and book value.
Relative valuation based on historical ratios of the company and S&P 500
In this analysis, P/E ratios of the five companies were compared to the P/E ratios of the S&P 500 index. Based on historic averages, multiples were generated for the analyzed companies using the S&P 500 index as a base.
Summary:
Taking the average of the fair values obtained from the previous sections, fair value for the five companies is calculated. The results are shown in the table that follows.
Based on the performed valuation analysis, URS, FLR and AECOM are undervalued, JEC is fairly valued and CBI is overvalued. Of the five companies, URS makes a good candidate for investment at these levels.
While Chicago Bridge & Iron is currently overvalued, the company has several growth opportunities in developing markets (which are expected to outperform the growth in developed markets in the short term) and is my preferred choice as a long term investment. I would ideally like to initiate a position in CBI below $22 a share. It should be noted that the stock has increased in value by approximately 30% in the past 6 months and a correction is warranted in my opinion.
(Kindly use this article for information purposes only. Please consult your investment advisor before making any investment decision.)
Disclosure: No positions

Tuesday, November 2, 2010

Coach: Expanding Into Men's Accessories


Coach (COH) released its earnings for Q1 2011 on October 26, 2010. The company reported stellar numbers with widening margins and gains in market share in all major regions where Coach operates. 
The $25 billion global luxury market for handbags and accessories (H&A) is projected to grow at an average annual rate of approximately 5% for the next few years. China is expected to be the major driver in increasing the market size. The country, according to various estimates, accounts for 10% of the global market. According to Coach, by the year 2013, China will double its share and contribute 20% of the total luxury market of handbags and accessories. In my last article on Coach, I outlined the growth opportunities in China and estimated that Coach could generate $1 billion in revenues in China by 2020. In the next 5 years, I estimate that the company will grow its earnings in China at an annual rate of 40% and report sales of approximately $537 million from China by 2015.This is higher than the $500 million the company expects to generate from China by 2015.
Additionally, the company recently launched its products in Europe (a flagship store is expected to open in London by June 2011), a continent responsible for about 25% of the global H&A market. Like North America and Japan, Coach is in the process of developing a multi channel delivery system for Europe and expects to generate $250 million in revenues from Europe in the next 5 years. In the years to come, the company also plans to enter the Indian and Brazilian markets.
Outside of China, Coach believes that its biggest opportunity is in the Men’s premium bag and small leather goods sector. The company estimates that it holds a 3% market share in the men’s segment in the U.S and hopes to improve this to about 14% in the next few years. In Japan, while the broader H&A segment is contracting, Coach reported that the men’s segment was stable. The company opened its first men’s only factory store in addition to its two stand alone stores and hopes to gain a market share of 16% to match that of the women’s segment.
In summary, I expect the U.S. sales to increase at an annual rate of 15% for the next 5 years, Japan by 2%, China by 40% and rest of world by 10%. As mentioned earlier, Europe will contribute $250 million to the top line by 2015. Based on my estimates, the company is projected to report earnings of $7.1 billion in 5 years time compared to the trailing twelve month revenue of $3.75 billion implying a compounded annual growth rate of approximately 14%.
Updating my DCF model, I derive an intrinsic value of $63 a share. My relative valuation model indicates a fair value of $45 a share. Combining these estimates, I estimate a fair value of $54 a share which is also my 12-month price target.

(Kindly use this article for information purposes only. Please consult your investment advisor before making any investment decision.)
Disclosure: Long COH

Friday, October 29, 2010

Is Netflix Overvalued?

Netflix (NFLX) is growing at an incredibly fast pace.  The company which started out as a DVD-rental-by-mail company is now transforming itself into a video streaming company.  While this business model has several advantages including reduced postage costs and better opportunities for international growth, the changed business model also reduces Netflix’s competitive advantages.  These competitive advantages over traditional brick and mortar companies, such as lower operating costs, were significant enough to force Blockbuster into bankruptcy. 

The new streaming video business model changes the primary threats to Netflix’s business from DVD rental companies such as Blockbuster and Coinstar to companies in the internet delivered video market.  According to Netflix’s annual report, the company expects intense competition from major companies in this segment such as YouTube, Hulu and Amazon (AMZN).  These competitors have deep pockets and are aggressively trying to make inroads in the online rental market, a sector which has few barriers to entry.  YouTube for example, recently hired a former Netflix Vice President for content acquisition in order to use the executive’s expertise to license more digital content.  

In addition to increased competition, costs associated with content acquisition have increased significantly with the move to streaming video business model. In the last quarter, the company spent $115 million on obtain video streaming rights compared to the $10 million it spent in Q3 2009. It signed an agreement with Epix in the region of $1 billion payable over 5 years.  Its existing deal with Starz expires next year and expectations are that extending the deal would also cost Netflix about a billion dollars.  These expenses make sense and are critical to the success of Netflix.  Before, the Epix deal, Netflix’s DVD catalog had approximately five-times as many titles as its streaming video catalog.

The company will also have to increase spending on maintaining and upgrading its infrastructure. As evidenced by the recent multi-hour outage of Netflix service, the rapidly increasing subscriber base will force Netflix to make substantial capital expenses.  The company currently has approximately $257 Million in cash and short term investments which is slightly below its targeted $260 Million cash reserves.  Its trailing 12 month free cash flow of $109 million should be insufficient to meet the investment needs of the company and I would be surprised if NFLX does not resort to raising capital either via an equity offering or by issuing debt.  If the company comes out with a follow on offering (which I suspect it will), it will have a major impact on existing shareholders as the current book value of equity is only $200 million compared to market value of approximately $9.2 billion.  Existing and future investors should keep this in mind while evaluating the investment potential of Netflix. 

Wall Street is thoroughly mixed on Netflix (NFLX). Of the 30 analysts covering the stock, 7 analysts have a Strong Buy rating and an equal number have a Strong Sell rating. Valuing a fast growing company such as Netflix is not an easy exercise.  The problem is exacerbated by the constantly changing nature of the industry and the entry of new products and services. Several companies are planning a push in international markets.  Most of the content deals that are in place for Netflix and other companies are restricted to a particular region.  Expanding in other countries will entail acquiring new and possibly local content in order to attract subscribers from those regions. Therefore, there are several unknowns which are hard to predict.  It is advisable to err in the side of caution and not be overly aggressive in projecting future growth in revenue and income. 

Valuation

Valuation analysis was performed by employing two methods:
  • Based on anticipated growth in subscribers over a 5 year period
  • Based on conventional discounted cash flow analysis

Based on anticipated growth in subscribers over a 5 year period

At the end Q3 2010, Netflix had 16.9 million subscribers with 15.8 million paid subscribers.  I am not too concerned about the increasing numbers of free subscribers as Netflix reports that 90% of these users continue on past the 1 month free period to become paid subscribers.  The company expects to end FY 2010 with 19.7 million total subscribers.  Assuming that the company reports 20 million total subscribers at year end with 94% paid subscribers, the company would have 18.8 million paid subscribers. 

With the company moving towards a streaming video business model, the average monthly revenue per subscriber has reduced from $13.3 during Q3 2009 to $12.12 during Q3 2010.  This trend is expected to continue as subscribers move towards a lower monthly fee plan.  In fact NFLX now offers a $7.99 streaming only plan in Canada and is currently testing the same plan in the US.  Analysts estimate that the average monthly revenue per subscriber will reduce to between $10 and $11 in the next few years.  Further, higher content acquisition costs is expected to reduce margins (this will be partly offset by the reductions in postage costs).  The company expects to maintain operating margins slightly higher than 12% for the North American business. 
                                                                                          
Coming to the growth rates, analysts expect a long term growth rate in earnings of 27%.  I expect the company to increase its subscribers at a faster pace than the growth rate in net income.  The valuation analysis shown below assumes that the number of subscribers will grow at an average annual rate of 35% for the first 2 years, 30% for the following 2 years, and at an average annual rate of 15.3% for years 5 through 10.   

Based on the assumptions outlined above, the following results are obtained:

-          Year 2020 Subscribers = 136 million
-          Year 2020 Revenue = $18 billion compared to TTM Revenue of $2.01 billion
-          Year 2020 Net Income = $1.38 billion
-          2020 Market Value of Equity = $20.7 billion (assuming a P/E of 15)
-          Present Value of Future Value of Equity = $9.00 billion (Discounted at cost of equity of 8.68%)
-          Market Value of Equity per Share = $167

Kindly note that if you apply a P/E of 20 (which would be high in my opinion), the market value increases to $222 a share.  On the other end of spectrum, a P/E of 10 would result in a fair value of $111 a share.

Based on conventional discounted cash flow analysis

DCF valuation of NFLX was performed by employing a two-stage model with a high growth period of 10 years.  The major inputs and the valuation results are presented below. 


NFLX
Bottom-Up Beta
1.03
Equity Risk Premium
6.0%
Cost of Equity
8.68%


Average Growth Rate (Years 1-5)
30%
Average Growth Rate (Years 6-10)
14.4%
Stable Growth Rate
2.5%


Present Value of FCFE in High Growth Period (Billions)
$0.86
Present Value of Terminal Value of Firm (Billions)
$6.32
Cash and Equivalents (Billions)
$0.26
Market Value of Equity
$7.44

Market Value of Equity/Share
$142

Based on the two estimates, the fair value of Netflix is somewhere between $142 and $166 in my opinion.  At mid-point, the fair value of the stock is $154.  With Netflix trading upwards of $175, the stock is overvalued by 14%.  Although I would not personally short this stock at the moment, I can see several reasons why the company makes a good short candidate.

(Kindly use this article for information purposes only. Please consult your investment advisor before making any investment decision)

Disclosure: None