With the S&P 500 up by approximately 11% since the beginning of September, as I mentioned in previous article on Johnson & Johnson (JNJ), it makes sense to add defensive stocks that pay solid dividends as a way to protect ones portfolio from any impending correction in the stock markets. In this article I will attempt to determine the fair value of one such defensive company: Colgate Palmolive (CL).
Company Financials and Valuation
Colgate Palmolive is a truly global company with its products sold in over 200 countries and approximately 75% of the total revenue coming from international operations. The company is a global leader in the liquid hand soap and specialty pet nutrition products markets.
CL has one of the longest histories of paying dividends. It has paid uninterrupted dividends to its shareholders from 1895. During the past 6 years, the quarterly dividend has more than doubled from $0.24 share to $0.53. The stock currently yields 2.83%.
The 10 year historical dividend payment chart is shown below.
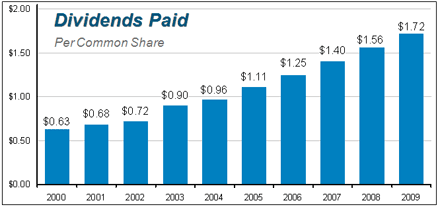
(Source: Colgate.com)
Company Fundamentals/Earnings
- Market Cap = $36.4 billion
- Sales (TTM) = $15.7 billion
- Income (TTM) = $2.2 billion
- Net Profit Margin = 14.6%
- Return on Equity (TTM) = 89%
- Return on Equity (Last 5 Yrs) = 100%
- Return on Assets (TTM) = 21.5%
- Return on Assets (Last 5 Yrs) = 18%
- Current Ratio = 1.29
- TTM EPS = $4.19
- Average Analyst 2010 EPS Estimate = $4.81
- Average Analyst 2011 EPS Estimate = $5.21
Discounted Cash Flow Valuation
DCF valuation of CL was performed by employing a two-stage model with a high growth period of 10 years. It should be noted that the assumed growth rate for the high growth period was calculated based on fundamentals. This growth rate of 8.46% compared favorably with average analyst estimate of 9%. The major inputs and the valuation results are presented below.
| | CL |
| High Growth Period | |
| Bottom-Up Beta for High Growth | 1.01 |
| Equity Risk Premium | 6.5% |
| Cost of Capital (Years 1 to 5) | 8.48% |
| Average Cost of Capital (Years 6 to 10) | 8.16% |
| Growth Rate (Years 1-5) | 8.48% |
| Average Growth Rate (Years 6-10) | 4.88% |
| | |
| Stable Growth Period | |
| Bottom-Up Beta for Stable Growth | 1.0 |
| Equity Risk Premium | 6.5% |
| Cost of Capital | 7.97% |
| Growth Rate | 2.5% |
| | |
| Valuation | |
| Present Value of FCFF in High Growth Period (Billions) | $18.3 |
| Present Value of Terminal Value of Firm (Billions) | $27.7 |
| Cash and Marketable Assets (Billions) | $0.61 |
| Total Firm Value (Billions) | $46.6 |
| Outstanding Debt | $3.3 |
| Market Value of Equity | $43.3 |
| | |
| Market Value of Equity/Share | $89 |
Relative Valuation
The estimated fair value using various relative valuation methods is presented below. It should be noted that the historical data was relied upon to develop the estimates shown below. Adjustments were made to account for outliers present in the dataset.
| | CL | ||
| Current | Estimate | Fair Value | |
| P/E | 17.85 | 18.88 | $79 |
| P/S | 2.31 | 2.62 | $85 |
| P/B | 14.51 | 17.65 | $91 |
| (P/E) / (P/E – Peers) | 1.00 | 1.10 | $82 |
| (P/E) / (P/E – S&P 500) | 0.93 | 1.03 | $83 |
| | Average | $84 | |
Fair Value
By blending my DCF and relative valuation based fair values, I estimate that the fair value of CL is approximately $86.5 a share which is also my short term price target. Based on this analysis, CL is currently trading at a discount of approximately 13%. Adding the returns from dividends, the company should deliver a total return in excess of 15% with comparatively low levels of risk over the next 1 year.
(Kindly use this article for information purposes only. Please consult your investment advisor before making any investment decision.)
Disclosure: No positions